Databases
Unit 3: Advanced Data Entry and Viewing
Lesson 7: Creating a Database Report
How do you edit a report from the Report Design view?
The most common procedure for creating a report is to:
- Use AutoReport or the Report Wizard to create a generic report for
a table or query.
- Use Report Design view to make any necessary adjustments.
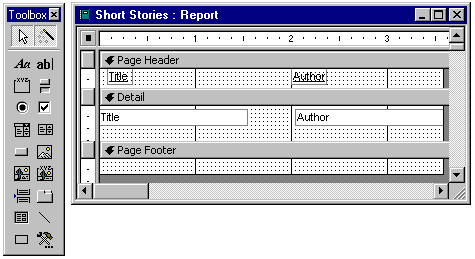
Report Design view is very much like Form Design view. The Design view is divided into sections and each section may contain controls or fields.
The toolbox contains a palette of controls that can be added to a report.

Sections control where on the report the data will print. For example,
information in the Page Header section will be printed at the top of each
page. Information in the Detail section will be printed once for each record
in the table or query.
There are many options for changing a report. In this lesson we will
look at only three:
- Moving field values.
- Changing the style of a field value.
- Using the Page Header to create columns of data.
The following animation shows an example of each of the above editing techniques.
Some things to notice in the above animation:
- The toolbar view button
 is
used to switch between Design view and Print Preview. (Notice that there is
another option available while in Design view: Layout view. Layout view
is like Print Preview but only a few records from the record source are
displayed. This view is useful when you are designing a report and have
a large data source.)
is
used to switch between Design view and Print Preview. (Notice that there is
another option available while in Design view: Layout view. Layout view
is like Print Preview but only a few records from the record source are
displayed. This view is useful when you are designing a report and have
a large data source.)
- The field labels are moved from the Detail section to the Page Header
section. Notice that when you paste a label into the detail section it
is inserted in the upper left-hand corner.
- The Detail section was made shorter in the vertical direction to reduce
the amount of space in between each detail record.
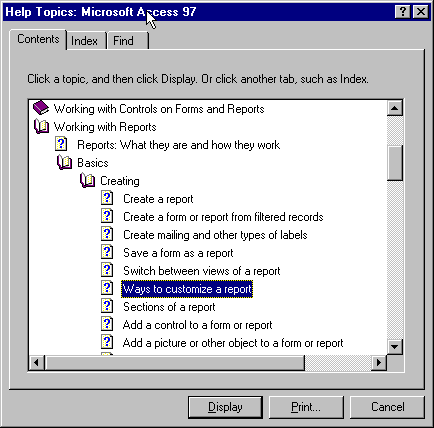
For more information about what's possible in Report Design view, see
the Help topic "Ways to customize a report":

|
Copyright 1997 by the Curators of the
University of Missouri
|


