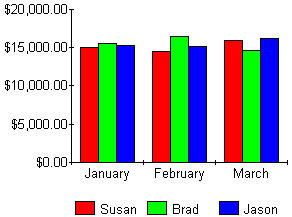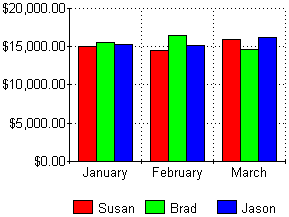
Grid lines in a chart are horizontal and vertical lines that make it easier to compare relative magnitudes. For example, the chart on the left doesn't have any grid lines which makes it difficult to compare between categories. The image below shows the same chart with grid lines. Chart grids are especially useful on large charts or charts with data of relatively equal magnitudes.
To turn grid lines on or off:
- Select your chart.
- Choose Chart Options from the Chart menu.
- Select the Gridlines tab and specify your grid lines preference.
