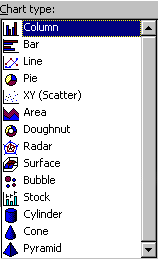

The image above shows the different types of charts you can create with Excel. The four main types of charts are column, bar, line, and pie. Within each type there are subtypes that define mostly cosmetic variations of the main type.
For more information about each chart type, including when to use a particular type, please refer to the on-line help sytem. Select Contents and Index from the Help menu, and then search the Index for chart types, examples.